Instead of doing a deep dive into one topic today, I have a few different points of discussion. First, thank you to Intelligent Economist for including me again this year in the top economics blog list. Second, I'll be joining a PhD program in Economics this fall and I can share my thoughts on the application procedure and offer whatever limited advice I have and hope/encouragement to those thinking about applying. This is particularly for those who have been out of school for more than a few years in job/grad school and those who found economics a little later in life (both of these apply to me). If I had one general piece of advice about PhD preparation, it is that I've found many people shy away from math and believe that only a few "select" individuals with innate abilities can be good at it (if I had a dollar for every economist I ran into while solving problems in a coffee shop who told me about the one genius in their college real analysis class) but - like anything else in life - I think those who are driven, purposeful, and work hard at it are well-rewarded.
One of the previous posts on this blog had discussed minimum wage policy. There wasn't enough time to cover all of the implications of minimum wage in that post, but I recently came across an interesting implication that I had not read about before. Specifically, a paper by Dettling and Hsu (2018) finds that higher minimum wages have significant effects on consumer credit markets (supply of unsecured credit, payday lending, and delinquency on credit payments). Higher minimum wages lead to lower borrowing costs for low income borrowers because they increase the number and favorability of credit card offers and they increase credit limits and decrease delinquencies. As noted in the paper, "labor market outcomes... are just one part of a household's finances. Interactions with consumer credit markets also play a crucial role in many families' economic wellbeing..."
Ethiopia gender diagnostic
The World Bank's Gender Innovation Lab - the team that I work for within the Office of the Chief Economist for Africa - has published a gender diagnostic report for Ethiopia. In this section, these views and interpretations are my own not that of the WB. The report does a few things: it provides evidence of gender gaps in agriculture, self-employment, and wage sectors in Ethiopia based on the Ethiopia Socioeconomic Surveys; it utilizes an Oaxaca-Blinder decomposition method to connect these gaps to gender gaps in the levels and returns to resources (e.g. fertilizer); and it provides concrete ideas to address the challenges that Ethiopian women face in the labor market. Oaxaca-Blinder decomposition decomposes the gender gap into observable differences in factors of production (endowment effect) and unexplained differences in returns to the same observed factors of production (structural effect). It allows us to determine to what extent differences in productivity are due to differences in the levels of resources versus the impact of those resources on productivity. It should be noted that the report is policy-oriented rather than academic in nature.
One example of a finding from this report is that the evidenced gender gap in agricultural productivity in Ethiopia is by and large due to unequal levels of productive factors such as land size and quality, fertilizer and other production inputs, formal credit, and farmer extension services (which can serve as a proxy for agricultural knowledge). When these - and other individual- and household-level observable characteristics - are controlled for, the gender gap in agricultural productivity drops from 36 percent to 6 percent. This is not necessarily the case in other countries in Sub-Saharan Africa, where giving female farmers access to the same level of productive factors as male farmers will not close the gender gap. For Ethiopia, we can assess how to close the gaps in factors of production.
For example, access to formal credit is an issue for not only female farmers but male farmers as well. The report on myths in African agriculture that I cited in an earlier post indicated that across the African continent only 6 percent of households used credit - formal or informal - to purchase agricultural inputs. It notes that "rural credit markets need to be deepened to serve farmers better, especially with respect to modern input use." On the other hand, the proliferation of farmer extension services is much greater with nearly 40 percent of male plot managers in Ethiopia having attended extension services recently (but only 23 percent of female plot managers having attended). There is a gender gap in both of these resources but while one has high take-up among male farmers, the other does not and therefore may require broader solutions.
If we focus on women's attendance of extension, we hypothesize based on existing literature and data that there are institutional factors that impact women's attendance and their level of agricultural knowledge more broadly. Namely, women are more time-constrained due to greater responsibilities in the home and are not as mobile due to costs of travel and to safety considerations. Both of these factors - time poverty and more limited mobility - can limit women's access to knowledge because they are not necessarily able to be in a particular place at a particular time to learn.
It is interesting because this underlying theme runs through many discussions about gender gaps in both the developed and developing worlds. A better understanding of how our existing systems are structured around the needs of specific subsets of our population can allow us to devise solutions that can better suit the needs of the others. For example, we posit that access to mobile phone technology can dramatically improve agricultural knowledge among female farmers because - conditional on their access to the technology - they will be able to access information at the time and place that is convenient for them (in Ethiopia, this is particularly challenging due to the limited competition in the telecommunications sector that has hindered mobile phone and internet penetration). Similarly, as this article in the Harvard Business Review illustrates, women in the developed world are advocating for more flexible working arrangements not to reduce hours but to manage workload at their own time and place where possible.
However, there are other important solutions as well. For example, investments into technologies that can alleviate the time poverty that women face in the first place. The tasks of collecting firewood, other fuel, and water for household energy consumption often fall on the women of the household and can take several hours per day in rural areas. Yet, there are interesting companies engaged in East Africa that are focused on addressing these energy consumption needs (some of which are highlighted in this report as examples). They provide alternatives to wood-fuel stoves in the form of solar energy or biodegradable biomass. This is just one example of how an evidence-based finding from the report can be developed to identify areas for future academic research, e.g. how successful are these alternative fuel companies and how effective are their alternatives at addressing women's time poverty? For more on these ideas, do check out the report.
Recession
There has been an upsurge in talk of recession recently in the popular media. It's not a topic that I've had much experience working on but I'll do my best to point out a few resources and start the conversation.
This article from the Fed lists the points of concern that have gotten analysts, investors, and economists talking in the first place. It lists four important housing market indicators, notes the significance of the housing market has in predicting economic downturns ("based on its forecasting track record - where a housing downturn is necessary but not sufficient for a recession to occur - the risk of broad-based economic recession certainly would be higher if the housing market were to weaken further"), and illustrates that recent trends are consistent with other pre-recessionary periods in 2001 and 2008.
The key is that current estimates of the four indicators listed - 30-year fixed mortgage rate, home sales rate, home-price change, and residential investment - are compared to their averages over the past three years to determine whether there is significant deviation from the average. For example, the below Fed chart shows the deviation in percentage points of the mortgage rate from the preceding three-year average. In the run up to the recessionary periods in 2001 and 2008 there was a rising deviation of the mortgage rate from the three-year average. The green trend for 2019 indicates the same pattern today.
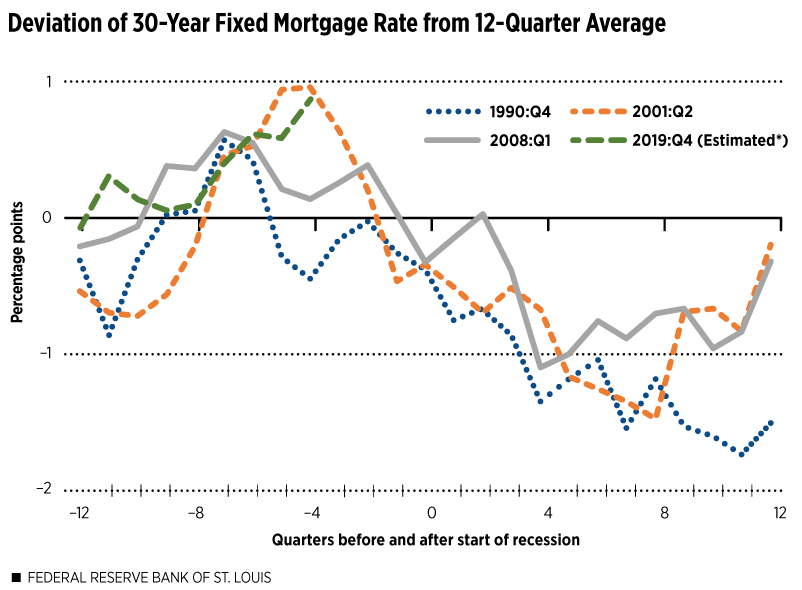
It is unclear in my opinion that the other three indicators track the 2001 and 2008 trendlines as closely as they do here for the mortgage rate but either way I think this is one part of a larger picture. The larger picture is that in 2001 and 2008 these housing market indicators worked in conjunction with a private sector financial deficit (financial deficit from households and firms). This is discussed in an episode of the Exchanges at Goldman Sachs podcast - which I highly recommend - on five areas of credit market risk and how they impact the likelihood of recession. It is just one section from a GS report, "Learning from a Century of US Recessions."
The report itself provides a high-level summary of the various risk areas that lead to economic downturns but does not provide much detail on the individual risk areas. The podcast does a better job of discussing in detail the primary risk area: financial risk and asset bubbles. The GS viewpoint is that the current private sector surplus differentiates the current situation from 2001 and 2008 where the housing market may have been heating up - as it is today - but at the same time the private sector was running a large deficit. These two deficit periods are indicated in the GS figure below.

In the podcast, it is also mentioned that debt growth for households in the mortgage market is in decline - 16 percent inflation adjusted decline - that is unprecedented in the past 60 years. I ran a quick chart using the Fed's data to see the trendlines for all mortgage holders (in blue) and one- to four- family residences (in orange) and they do indicate a slow growth in recent years. How much slower than in the rest of the 30-year period shown here (1990-2018) is not clear since the trendline is still rising. However, it is unsurprising that mortgage debt is rising more slowly now than in the pre-2008 period given tighter credit standards in the aftermath of the Great Recession.
 It is possible that an overheating of the housing market and relatively slow mortgage debt growth for households are consistent with one another if mortgage debt and home-ownership are more concentrated today than they were pre-2008. It would be interesting to see whether a smaller segment of the population is driving the uptick in the housing indicators being measured by comparing mortgage debt and home-ownership across the income distribution today and pre-2008. Tighter credit standards and more sluggish recovery among lower- and middle-income households after the 2008 economic downturn, in addition to rising income inequality in the aftermath of the downturn, may explain greater concentration in debt and home-ownership today. This could explain trends in the housing market as well as the private sector financial balance.
One of the previous posts on this blog had discussed minimum wage policy. There wasn't enough time to cover all of the implications of minimum wage in that post, but I recently came across an interesting implication that I had not read about before. Specifically, a paper by Dettling and Hsu (2018) finds that higher minimum wages have significant effects on consumer credit markets (supply of unsecured credit, payday lending, and delinquency on credit payments). Higher minimum wages lead to lower borrowing costs for low income borrowers because they increase the number and favorability of credit card offers and they increase credit limits and decrease delinquencies. As noted in the paper, "labor market outcomes... are just one part of a household's finances. Interactions with consumer credit markets also play a crucial role in many families' economic wellbeing..."
Ethiopia gender diagnostic
The World Bank's Gender Innovation Lab - the team that I work for within the Office of the Chief Economist for Africa - has published a gender diagnostic report for Ethiopia. In this section, these views and interpretations are my own not that of the WB. The report does a few things: it provides evidence of gender gaps in agriculture, self-employment, and wage sectors in Ethiopia based on the Ethiopia Socioeconomic Surveys; it utilizes an Oaxaca-Blinder decomposition method to connect these gaps to gender gaps in the levels and returns to resources (e.g. fertilizer); and it provides concrete ideas to address the challenges that Ethiopian women face in the labor market. Oaxaca-Blinder decomposition decomposes the gender gap into observable differences in factors of production (endowment effect) and unexplained differences in returns to the same observed factors of production (structural effect). It allows us to determine to what extent differences in productivity are due to differences in the levels of resources versus the impact of those resources on productivity. It should be noted that the report is policy-oriented rather than academic in nature.
One example of a finding from this report is that the evidenced gender gap in agricultural productivity in Ethiopia is by and large due to unequal levels of productive factors such as land size and quality, fertilizer and other production inputs, formal credit, and farmer extension services (which can serve as a proxy for agricultural knowledge). When these - and other individual- and household-level observable characteristics - are controlled for, the gender gap in agricultural productivity drops from 36 percent to 6 percent. This is not necessarily the case in other countries in Sub-Saharan Africa, where giving female farmers access to the same level of productive factors as male farmers will not close the gender gap. For Ethiopia, we can assess how to close the gaps in factors of production.
For example, access to formal credit is an issue for not only female farmers but male farmers as well. The report on myths in African agriculture that I cited in an earlier post indicated that across the African continent only 6 percent of households used credit - formal or informal - to purchase agricultural inputs. It notes that "rural credit markets need to be deepened to serve farmers better, especially with respect to modern input use." On the other hand, the proliferation of farmer extension services is much greater with nearly 40 percent of male plot managers in Ethiopia having attended extension services recently (but only 23 percent of female plot managers having attended). There is a gender gap in both of these resources but while one has high take-up among male farmers, the other does not and therefore may require broader solutions.
If we focus on women's attendance of extension, we hypothesize based on existing literature and data that there are institutional factors that impact women's attendance and their level of agricultural knowledge more broadly. Namely, women are more time-constrained due to greater responsibilities in the home and are not as mobile due to costs of travel and to safety considerations. Both of these factors - time poverty and more limited mobility - can limit women's access to knowledge because they are not necessarily able to be in a particular place at a particular time to learn.
It is interesting because this underlying theme runs through many discussions about gender gaps in both the developed and developing worlds. A better understanding of how our existing systems are structured around the needs of specific subsets of our population can allow us to devise solutions that can better suit the needs of the others. For example, we posit that access to mobile phone technology can dramatically improve agricultural knowledge among female farmers because - conditional on their access to the technology - they will be able to access information at the time and place that is convenient for them (in Ethiopia, this is particularly challenging due to the limited competition in the telecommunications sector that has hindered mobile phone and internet penetration). Similarly, as this article in the Harvard Business Review illustrates, women in the developed world are advocating for more flexible working arrangements not to reduce hours but to manage workload at their own time and place where possible.
However, there are other important solutions as well. For example, investments into technologies that can alleviate the time poverty that women face in the first place. The tasks of collecting firewood, other fuel, and water for household energy consumption often fall on the women of the household and can take several hours per day in rural areas. Yet, there are interesting companies engaged in East Africa that are focused on addressing these energy consumption needs (some of which are highlighted in this report as examples). They provide alternatives to wood-fuel stoves in the form of solar energy or biodegradable biomass. This is just one example of how an evidence-based finding from the report can be developed to identify areas for future academic research, e.g. how successful are these alternative fuel companies and how effective are their alternatives at addressing women's time poverty? For more on these ideas, do check out the report.
Recession
There has been an upsurge in talk of recession recently in the popular media. It's not a topic that I've had much experience working on but I'll do my best to point out a few resources and start the conversation.
This article from the Fed lists the points of concern that have gotten analysts, investors, and economists talking in the first place. It lists four important housing market indicators, notes the significance of the housing market has in predicting economic downturns ("based on its forecasting track record - where a housing downturn is necessary but not sufficient for a recession to occur - the risk of broad-based economic recession certainly would be higher if the housing market were to weaken further"), and illustrates that recent trends are consistent with other pre-recessionary periods in 2001 and 2008.
The key is that current estimates of the four indicators listed - 30-year fixed mortgage rate, home sales rate, home-price change, and residential investment - are compared to their averages over the past three years to determine whether there is significant deviation from the average. For example, the below Fed chart shows the deviation in percentage points of the mortgage rate from the preceding three-year average. In the run up to the recessionary periods in 2001 and 2008 there was a rising deviation of the mortgage rate from the three-year average. The green trend for 2019 indicates the same pattern today.
It is unclear in my opinion that the other three indicators track the 2001 and 2008 trendlines as closely as they do here for the mortgage rate but either way I think this is one part of a larger picture. The larger picture is that in 2001 and 2008 these housing market indicators worked in conjunction with a private sector financial deficit (financial deficit from households and firms). This is discussed in an episode of the Exchanges at Goldman Sachs podcast - which I highly recommend - on five areas of credit market risk and how they impact the likelihood of recession. It is just one section from a GS report, "Learning from a Century of US Recessions."
The report itself provides a high-level summary of the various risk areas that lead to economic downturns but does not provide much detail on the individual risk areas. The podcast does a better job of discussing in detail the primary risk area: financial risk and asset bubbles. The GS viewpoint is that the current private sector surplus differentiates the current situation from 2001 and 2008 where the housing market may have been heating up - as it is today - but at the same time the private sector was running a large deficit. These two deficit periods are indicated in the GS figure below.

In the podcast, it is also mentioned that debt growth for households in the mortgage market is in decline - 16 percent inflation adjusted decline - that is unprecedented in the past 60 years. I ran a quick chart using the Fed's data to see the trendlines for all mortgage holders (in blue) and one- to four- family residences (in orange) and they do indicate a slow growth in recent years. How much slower than in the rest of the 30-year period shown here (1990-2018) is not clear since the trendline is still rising. However, it is unsurprising that mortgage debt is rising more slowly now than in the pre-2008 period given tighter credit standards in the aftermath of the Great Recession.
 It is possible that an overheating of the housing market and relatively slow mortgage debt growth for households are consistent with one another if mortgage debt and home-ownership are more concentrated today than they were pre-2008. It would be interesting to see whether a smaller segment of the population is driving the uptick in the housing indicators being measured by comparing mortgage debt and home-ownership across the income distribution today and pre-2008. Tighter credit standards and more sluggish recovery among lower- and middle-income households after the 2008 economic downturn, in addition to rising income inequality in the aftermath of the downturn, may explain greater concentration in debt and home-ownership today. This could explain trends in the housing market as well as the private sector financial balance.

